


AIOU 9383 Quantitative Reasoning-II Solved Assignment 1 Spring 2025
AIOU 9383 Assignment 1
Q1 a). Graph the function 𝑓(𝑥) = 2x² − 4𝑥 + 1. Label the vertex, symmetry and intercepts. Determine if the function is one-to-one or not. If not restrict the domain to make it invertible and find its inverse.

Graph the function 𝑓(𝑥) = 2𝑥^2 − 4𝑥 + 1. Label the vertex, symmetry, and intercepts. Determine if the function is one-to-one or not. If not, restrict the domain to make it invertible and find its inverse.
The given quadratic function is:
\[ f(x) = 2x^2 - 4x + 1 \]
Since the coefficient of \(x^2\) is positive, the parabola opens **upward**.
Vertex:
The vertex of a quadratic function \( ax^2 + bx + c \) is given by:
\[ x = \frac{-b}{2a} \]
Here, \( a = 2 \), \( b = -4 \):
\[ x = \frac{-(-4)}{2(2)} = \frac{4}{4} = 1 \]
To find the y-coordinate:
\[ f(1) = 2(1)^2 - 4(1) + 1 = 2 - 4 + 1 = -1 \]
So, the vertex is \( (1, -1) \).
Axis of Symmetry:
Since the vertex is \( x = 1 \), the axis of symmetry is:
\[ x = 1 \]
Intercepts:
- Y-intercept: Set \( x = 0 \):
\[ f(0) = 2(0)^2 - 4(0) + 1 = 1 \]
So, y-intercept is \( (0, 1) \).
- X-intercepts:** Solve \( 2x^2 - 4x + 1 = 0 \) using the quadratic formula:
\[ x = \frac{-(-4) \pm \sqrt{(-4)^2 - 4(2)(1)}}{2(2)} \]
\[ x = \frac{4 \pm \sqrt{16 - 8}}{4} = \frac{4 \pm \sqrt{8}}{4} \]
\[ x = \frac{4 \pm 2\sqrt{2}}{4} = \frac{2 \pm \sqrt{2}}{2} \]
So, the x-intercepts are \( \left(\frac{2 - \sqrt{2}}{2}, 0\right) \) and \( \left(\frac{2 + \sqrt{2}}{2}, 0\right) \).
One-to-One Check:
A function is one-to-one if it passes the horizontal line test. Since this is a quadratic function, it is not one-to-one.
To make it invertible, we restrict the domain. A common restriction is to take only the right side (\( x \geq 1 \)) or left side (\( x \leq 1 \)) of the parabola.
Find Inverse:
We first express \( y = f(x) \):
\[ y = 2x^2 - 4x + 1 \]
Solve for \( x \) in terms of \( y \):
1. Swap \( x \) and \( y \):
\[ x = 2y^2 - 4y + 1 \]
2. Solve for \( y \) using the quadratic formula:
\[ y = \frac{4 \pm \sqrt{16 - 8(x - 1)}}{4} \]
\[ y = \frac{4 \pm \sqrt{8(x - 1)}}{4} \]
\[ y = \frac{2 \pm \sqrt{2(x - 1)}}{2} \]
Since we restricted the domain to \( x \geq 1 \), we take only the **positive** root:
\[ f^{-1}(x) = \frac{2 + \sqrt{2(x - 1)}}{2} \]
Final Answer:
- Graph: Parabola opening **upward**.
- Vertex: \( (1, -1) \).
- Axis of symmetry: \( x = 1 \).
- Intercepts:
- Y-intercept: \( (0, 1) \).
- X-intercepts: \( \left(\frac{2 - \sqrt{2}}{2}, 0\right) \) and \( \left(\frac{2 + \sqrt{2}}{2}, 0\right) \).
- Not one-to-one.
- Restricted domain: \( x \geq 1 \) to make it invertible.
- Inverse function: \( f^{-1}(x) = \frac{2 + \sqrt{2(x - 1)}}{2} \).
Q1 b). A factory has a 5% defect rate. Using the binomial distribution, calculate the probability of at most 2 defective items in a batch of 50. Interpret the result for quality control.
We can calculate the probability of at most 2 defective items in a batch of 50 using the binomial distribution formula:
\[ P(X = k) = \binom{n}{k} p^k (1-p)^{n-k} \]
where:
- \( n = 50 \) (batch size)
- \( p = 0.05 \) (defect rate)
- \( k \) is the number of defective items (0, 1, or 2)
We need to find:
\[ P(X \leq 2) = P(X = 0) + P(X = 1) + P(X = 2) \]
Using a binomial probability calculator or manual computation:
\[ P(X = 0) \approx 0.0769 \]
\[ P(X = 1) \approx 0.2025 \]
\[ P(X = 2) \approx 0.2642 \]
Adding these probabilities:
\[ P(X \leq 2) = 0.0769 + 0.2025 + 0.2642 \approx 0.5436 \]
Interpretation:
There is about a 54.36% chance that a batch of 50 items will have at most 2 defective items. For quality control, this suggests that more than half the time, the defect count will stay within an acceptable range (assuming a threshold of 2 is reasonable). If a lower defect rate is desired, improvements in the manufacturing process should be considered.
Q2 a). A smartphone’s price increased by 25% in 2022 and decreased by 15% in 2023. Calculate the net percentage change over the two years. If the original price is Rs. 80,000. Find the final price.
Step 1: Calculate the price after the 25% increase in 2022
Original price = Rs. 80,000
Increase = \( 80,000 \times \frac{25}{100} = 20,000 \)
New price after increase = \( 80,000 + 20,000 = 100,000 \)
Step 2: Calculate the price after the 15% decrease in 2023
Decrease = \( 100,000 \times \frac{15}{100} = 15,000 \)
Final price = \( 100,000 - 15,000 = 85,000 \)
Step 3: Calculate the net percentage change
Net change = \( \frac{\text{Final price} - \text{Original price}}{\text{Original price}} \times 100 \)
Net change = \( \frac{85,000 - 80,000}{80,000} \times 100 \)
Net change = \( \frac{5,000}{80,000} \times 100 \)
Net change = \( 6.25\% \) increase
Final Answer: The final price of the smartphone is Rs. 85,000, and the net percentage change over the two years is a 6.25% increase.
Q2 b). The profit function of a company is P(x) = -2x² + 100x − 800, where x is the units sold. Calculate the maximum profit and the number of units required to break even (profit = 0).
The profit function is a quadratic equation: \( P(x) = -2x^2 + 100x - 800 \).
Since the coefficient of \( x^2 \) is negative (-2), the parabola opens downward, meaning it has a maximum point.
Maximum Profit Calculation:
To find the maximum profit, we use the vertex formula:
\[ x = \frac{-b}{2a} \]
where \( a = -2 \) and \( b = 100 \):
\[ x = \frac{-100}{2(-2)} = \frac{100}{4} = 25 \]
Substituting \( x = 25 \) into \( P(x) \):
\[ P(25) = -2(25)^2 + 100(25) - 800 \]
\[ = -2(625) + 2500 - 800 \]
\[ = -1250 + 2500 - 800 = 450 \]
The maximum profit is 450 currency units at x = 25 units.
Break-Even Points:
Setting \( P(x) = 0 \):
\[ -2x^2 + 100x - 800 = 0 \]
Dividing by -2:
\[ x^2 - 50x + 400 = 0 \]
Using the quadratic formula:
\[ x = \frac{-(-50) \pm \sqrt{(-50)^2 - 4(1)(400)}}{2(1)} \]
\[ x = \frac{50 \pm \sqrt{2500 - 1600}}{2} \]
\[ x = \frac{50 \pm \sqrt{900}}{2} \]
\[ x = \frac{50 \pm 30}{2} \]
Solutions:
\[ x = \frac{50 + 30}{2} = 40 \]
\[ x = \frac{50 - 30}{2} = 10 \]
The company breaks even at x = 10 units and x = 40 units.
Final Answer:
- Maximum Profit: 450 currency units at x = 25 units.
- Break-Even Points: x = 10 units** and x = 40 units.
Q3 a). For the geometric sequence 5, 15, 45,..., derive the general term an .Calculate the sum of the first 8 terms and interpret the sequence in a real-world context (e.g., viral growth).
Finding the General Term an
The given sequence is:
5, 15, 45, ...
To determine the general term an, we need the first term a1 and the common ratio r:
First term: a1 = 5
Common ratio:
r = 15 / 5 = 3
r = 45 / 15 = 3
Since it’s a geometric sequence, the general formula for the n-th term is:
\( a_n = a_1 \cdot r^{(n-1)} \)
Substituting the values:
\( a_n = 5 \cdot 3^{(n-1)} \)
Calculating the Sum of the First 8 Terms
The sum of the first n terms of a geometric sequence is given by:
\( S_n = a_1 \frac{1 - r^n}{1 - r} \)
For n = 8:
\( S_8 = 5 \frac{1 - 3^8}{1 - 3} \)
\( S_8 = 5 \frac{1 - 6561}{-2} \)
\( S_8 = 5 \frac{-6560}{-2} \)
\( S_8 = 5 \cdot 3280 \)
\( S_8 = 16400 \)
Real-World Context: Viral Growth
This sequence resembles exponential growth, which is common in scenarios like:
- Viral Social Media Posts: If a video gets shared by 3 people, and each of them shares with 3 more, the views increase exponentially.
- Epidemic Spread: In disease transmission models, an infection rate following a geometric progression can indicate rapid spread within a population.
- Business Growth: A startup acquiring 3 new clients each cycle, who then refer 3 more clients, could see exponential customer expansion.
Let’s say a post starts with 5 shares and each person shares it with 3 more—it would reach 16,400 people in just 8 cycles.
Exponential growth can be exciting, but in some cases—like disease transmission—it requires careful management.
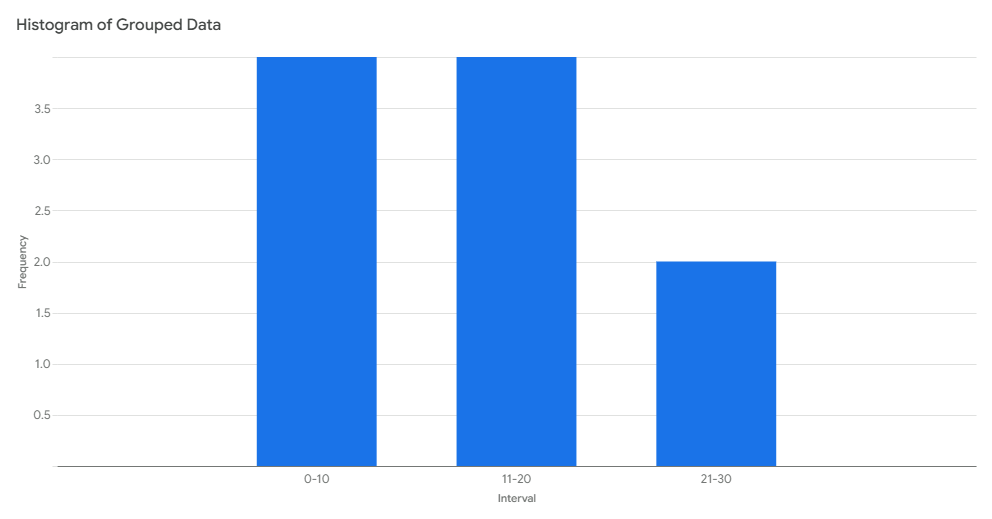
Q3 b). Construct a grouped frequency table (class-intervals; 0-10, 11-20, etc.) and a histogram for the dataset: 5, 12, 18, 7, 25, 14, 22, 9, 16, 3.
Here’s the grouped frequency table for the given dataset:
| Class Interval | Frequency |
|---|---|
| 0 - 10 | 4 |
| 11 - 20 | 4 |
| 21 - 30 | 2 |
Explanation:
- The values 3, 5, 7, and 9 fall into the 0 - 10 class interval.
- The values 12, 14, 16, and 18 fall into the 11 - 20 class interval.
- The values 22 and 25 fall into the 21 - 30 class interval.
For the histogram, you can plot a bar chart with the class intervals on the x-axis and their corresponding frequency on the y-axis.
Q4 a). A car speed is modeled by v(t) = 3t² - 12t + 10 (in m/s). Calculate the average rate of change of speed between t = 2 and t = 5. Interpret the result physically.
To calculate the average rate of change of speed, we use the formula:
$$ \text{Average Rate of Change} = \frac{v(5) - v(2)}{5 - 2} $$
First, let's evaluate \( v(5) \) and \( v(2) \):
$$ v(5) = 3(5)^2 - 12(5) + 10 = 75 - 60 + 10 = 25 \text{ m/s} $$
$$ v(2) = 3(2)^2 - 12(2) + 10 = 12 - 24 + 10 = -2 \text{ m/s} $$
Now, calculating the average rate of change:
$$ \frac{25 - (-2)}{5 - 2} = \frac{25 + 2}{3} = \frac{27}{3} = 9 \text{ m/s²} $$
Physical Interpretation: This result means that, on average, the car's speed increased at a rate of 9 m/s² over the time interval from \( t = 2 \) to \( t = 5 \). Essentially, the car was accelerating during this period at an average rate of 9 m/s².
Q4 b). For the dataset 4,7,9,10,12, compute the mean, variance and stand deviation. Explain why variance is sensitive to outliers.
Compute Mean:
The mean is calculated as:
$$\text{Mean} = \frac{\sum X}{n} = \frac{4+7+9+10+12}{5} = \frac{42}{5} = 8.4$$
Compute Variance:
Variance measures the spread of data points from the mean:
$$\sigma^2 = \frac{\sum (X - \text{Mean})^2}{n}$$
Calculating squared differences:
$$ \begin{aligned} (4 - 8.4)^2 &= 19.36 \\ (7 - 8.4)^2 &= 1.96 \\ (9 - 8.4)^2 &= 0.16 \\ (10 - 8.4)^2 &= 2.56 \\ (12 - 8.4)^2 &= 12.96 \\ \end{aligned} $$
Summing these:
$$19.36 + 1.96 + 0.16 + 2.56 + 12.96 = 37$$
Thus, variance:
$$\sigma^2 = \frac{37}{5} = 7.4$$
Compute Standard Deviation:
The standard deviation is the square root of variance:
$$\sigma = \sqrt{7.4} \approx 2.72$$
Why is Variance Sensitive to Outliers?
Variance uses squared differences from the mean, making large deviations disproportionately impactful. An extreme value like 50 would drastically increase variance due to squaring. This sensitivity is why standard deviation or the median is often preferred for datasets with outliers.
Q5 a). A box contains 6 red, 4 blue and 5 green balls. Two balls are drawn with replacement. Calculate the probability of getting one red and one green ball. Then repeat the calculation without replacement and compare the results.
With Replacement:
Since each draw is independent, the probability of drawing a red ball first and a green ball second is:
\[ P(R, G) = P(R) \times P(G) = \frac{6}{15} \times \frac{5}{15} = \frac{30}{225} = \frac{2}{15} \]
Similarly, drawing a green ball first and a red ball second gives:
\[ P(G, R) = P(G) \times P(R) = \frac{5}{15} \times \frac{6}{15} = \frac{30}{225} = \frac{2}{15} \]
Adding these two possibilities together:
\[ P(1\text{ red, }1\text{ green}) = \frac{2}{15} + \frac{2}{15} = \frac{4}{15} \]
Without Replacement:
Now, since the first draw affects the second, we modify our probabilities.
For drawing a red ball first and a green ball second:
\[ P(R, G) = P(R) \times P(G | R) = \frac{6}{15} \times \frac{5}{14} = \frac{30}{210} = \frac{1}{7} \]
For drawing a green ball first and a red ball second:
\[ P(G, R) = P(G) \times P(R | G) = \frac{5}{15} \times \frac{6}{14} = \frac{30}{210} = \frac{1}{7} \]
Adding both cases together:
\[ P(1\text{ red, }1\text{ green}) = \frac{1}{7} + \frac{1}{7} = \frac{2}{7} \approx 0.2857 \]
Comparison:
- With replacement: \( \frac{4}{15} \approx 0.2667 \)
- Without replacement: \( \frac{2}{7} \approx 0.2857 \)
The probability is slightly higher without replacement, because removing a ball affects the composition of the remaining choices.
Q5 b). Using the permutations, determine how many distinct 5-letter codes can be formed from the words ALGEBRA if no letter repeats. Validate your answer using factorial notation.
Using permutations, determine how many distinct 5-letter codes can be formed from the word ALGEBRA if no letter repeats. Validate your answer using factorial notation.
To determine how many distinct 5-letter codes can be formed using the letters in "ALGEBRA" without repetition, we use permutations.
Step 1: Identify the Available Letters
The word ALGEBRA consists of 7 letters: A, L, G, E, B, R, and A. However, since the letter A appears twice, we have 6 unique letters: A, L, G, E, B, and R.
Step 2: Apply Permutations Formula
When selecting 5 letters from 6 unique letters, the number of ways to arrange them is given by the formula:
$$P(n, r) = \frac{n!}{(n-r)!}$$
where:
\( n = 6 \) (total unique letters),
\( r = 5 \) (letters chosen),
\( ! \) represents factorial notation.
Step 3: Compute the Value
$$P(6,5) = \frac{6!}{(6-5)!} = \frac{6!}{1!}$$
Expanding factorials:
$$6! = 6 \times 5 \times 4 \times 3 \times 2 \times 1 = 720$$
$$1! = 1$$
So,
$$P(6,5) = \frac{720}{1} = 720$$
Conclusion:
Thus, 720 distinct 5-letter codes can be formed from "ALGEBRA" without repeating letters.
AIOU 9383 Quantitative Reasoning-II Solved Assignment 2 Spring 2025
AIOU 9383 Assignment 2
Q1 a). A forest's deer population grows exponentially at 8% annually. If the current population is 1200, write the growth equation and estimate the population after 7 years. Calculate the doubling time.
Growth Equation:
Exponential population growth follows the equation:
\[ P(t) = P_0 e^{rt} \]
where:
- \(P(t)\) is the population at time \(t\),
- \(P_0\) is the initial population,
- \(r\) is the annual growth rate (8% = 0.08),
- \(t\) is the number of years,
- \(e\) is the mathematical constant (approximately 2.718).
Plugging in the given values:
\[ P(t) = 1200 e^{0.08t} \]
Population After 7 Years:
Using \( t = 7 \):
\[ P(7) = 1200 e^{(0.08 \times 7)} \]
\[ P(7) = 1200 e^{0.56} \]
Approximating \( e^{0.56} \approx 1.75 \):
\[ P(7) \approx 1200 \times 1.75 = 2100 \]
So, after 7 years, the estimated deer population is about 2100.
Doubling Time:
The doubling time for exponential growth follows:
\[ T_d = \frac{\ln(2)}{r} \]
where \( \ln(2) \approx 0.693 \).
\[ T_d = \frac{0.693}{0.08} \approx 8.66 \text{ years} \]
So, the deer population will double in approximately 8.7 years.
Q1 b). A school allocates 20 scholarships to two departments (A: 120 students, B: 80 students) using the Hamilton method. Calculate the fair apportionment and identify any paradoxes.
Step 1: Calculate Standard Quotas
The total number of students is: $$120 + 80 = 200$$
Each department’s standard quota is found using the formula:
$$\text{Quota} = \frac{\text{Department's students}}{\text{Total students}} \times \text{Total scholarships}$$
For Department A:
$$\frac{120}{200} \times 20 = 12$$
For Department B:
$$\frac{80}{200} \times 20 = 8$$
Thus, both departments receive exactly whole numbers (12 and 8), meaning no rounding is needed, and the allocation is straightforward:
Department A gets 12 scholarships
Department B gets 8 scholarships
Identifying Paradoxes
The Hamilton method can sometimes lead to paradoxes such as:
- Alabama Paradox: Increasing total scholarships might result in a department losing a scholarship.
- Population Paradox: If Department A gains students but Department B does not, A could paradoxically receive fewer scholarships.
- New States Paradox: If a new department is added, it could shift existing allocations unfairly.
Since our calculations resulted in integer values without needing adjustments, no paradoxes arise in this specific case. However, if fractional parts were involved and required rounding, one of these paradoxes could potentially emerge.
Q2 a). The pH scale is logarithmic: pH = -log[H+]. If solution A has [H+] = 10-3 and solution B has [H+] = 10-5. Calculate their pH values. Explain why a pH difference of 2 implies a 100-fold difference in acidity.
Step 1: Calculating the pH values
We use the formula:
$$\text{pH} = -\log [H^+]$$
For solution A:
$$\text{pH} = -\log (10^{-3}) = 3$$
For solution B:
$$\text{pH} = -\log (10^{-5}) = 5$$
So, solution A has a pH of 3, and solution B has a pH of 5.
Step 2: Understanding the pH difference and acidity
The pH scale is logarithmic, meaning that a difference of 1 unit on the pH scale represents a 10-fold difference in hydrogen ion concentration \([H^+]\).
Since solution A (\(\text{pH} = 3\)) has a hydrogen ion concentration of \(10^{-3}\), and solution B (\(\text{pH} = 5\)) has a concentration of \(10^{-5}\), the difference in pH is 2 units.
$$10^{-3} \div 10^{-5} = 10^{2} = 100$$
Thus, solution A is 100 times more acidic than solution B.
Why does this happen?
Because the pH scale follows base-10 logarithms, every step down (lower pH) represents ten times more \(H^+\) ions. A two-step difference multiplies this effect by \(10 \times 10 = 100\), creating a 100-fold increase in acidity.
Q2 b). Derive the exponential model y = abx for a bacteria culture that grows from 200 to 600 in 4 hours. Predict the population after 10 hours.
Step 1: Find \( b \)
Given:
- Initial population: \( a = 200 \)
- Population after 4 hours: \( y = 600 \)
- Time: \( x = 4 \)
Using the equation:
\( 600 = 200b^4 \)
Solving for \( b \):
\( b^4 = \frac{600}{200} = 3 \)
\( b = \sqrt[4]{3} \)
Approximating:
\( b \approx 1.316 \)
Step 2: Derive the Model
Now, we substitute \( a = 200 \) and \( b \approx 1.316 \):
\( y = 200 (1.316)^x \)
Step 3: Predict Population After 10 Hours
Substituting \( x = 10 \):
\( y = 200 (1.316)^{10} \)
Approximating:
\( y \approx 200 \times 13.42 \)
\( y \approx 2684 \)
So, after 10 hours, the bacteria population will be approximately 2,684.
Q3 a). A Koch snowflake fractal is generated by replacing each line segment with 4 smaller segments. If the initial perimeter is 27cm, calculate the perimeter after 3 iterations. Explain why the perimeter approaches infinity.
Perimeter Calculation
Initially, the Koch snowflake starts with a perimeter of 27 cm. Each iteration replaces each segment with four smaller segments, each one-third the length of the original.
First iteration:
Each segment is replaced by 4 smaller segments, increasing the total perimeter by a factor of \( \frac{4}{3} \).
$$ P_1 = 27 \times \frac{4}{3} = 36 \text{ cm} $$
Second iteration:
Again, each segment is replaced similarly:
$$ P_2 = 36 \times \frac{4}{3} = 48 \text{ cm} $$
Third iteration:
Continuing the pattern:
$$ P_3 = 48 \times \frac{4}{3} = 64 \text{ cm} $$
Why the Perimeter Approaches Infinity
With each iteration, the perimeter increases by a factor of \( \frac{4}{3} \). Mathematically, after \( n \) iterations, the perimeter is given by:
$$ P_n = 27 \times \left(\frac{4}{3}\right)^n $$
Since \( \frac{4}{3} > 1 \), the perimeter grows exponentially. As \( n \) approaches infinity, the perimeter tends toward an infinite length, meaning the fractal boundary becomes infinitely long while still fitting within a finite space.
This is a hallmark of fractals—infinitely complex structures emerging from simple iterative rules.
Q3 b). Explain the Arrow Impossibility Theorem and its implications for voting systems. Illustrate with an example of ranked voting.
Arrow Impossibility Theorem: The theorem states that no ranked voting system can satisfy all of the following fairness criteria simultaneously when there are three or more candidates:
1. Unrestricted Domain (Universality): The system should work for all possible individual preference orders.
2. Non-Dictatorship: No single voter should have the power to determine the overall outcome.
3. Pareto Efficiency: If every voter prefers candidate A over candidate B, then A should rank higher than B in the final outcome.
4. Independence of Irrelevant Alternatives (IIA): Changing rankings of candidates not in consideration should not affect the final outcome.
Implications for Voting Systems: Arrow's theorem shows that any ranked voting system must compromise on at least one of these fairness conditions. This means no perfect system exists that guarantees a completely fair outcome, making voting system design a matter of prioritizing trade-offs.
Example: Ranked Voting System (Instant Runoff Voting - IRV)
Imagine an election with three candidates: A, B, and C, and voters rank them:
- 40% of voters: A > B > C
- 35% of voters: B > C > A
- 25% of voters: C > B > A
Now let's apply Instant Runoff Voting (IRV):
- The first preference votes are counted. If no candidate has a majority (>50%), the lowest-ranked candidate is eliminated.
- Suppose C is eliminated first (25% preference).
- The second-choice votes from C’s voters (which mostly favored B) are redistributed.
- With C’s elimination, B gets enough votes to win.
Potential Violation of IIA: If another candidate, say D, were in the race but later dropped out, the results could change even if no one's direct preference between A and B had shifted—showing the violation of Independence of Irrelevant Alternatives (IIA).
Conclusion: Arrow’s theorem proves that all voting systems have flaws, forcing societies to balance fairness, practicality, and strategic behavior when designing elections. That’s why many countries use different methods—majority rule, ranked choice, or proportional representation—depending on their priorities.
Q4 a). The cylindrical tank has a radius of 5m and a height of 12m. Calculate its volume and surface area. If the tank is scaled down by a factor 1/2, compute the new volume and explain the geometric relationship.
Initial Tank Calculations
A cylinder's volume \(V\) is given by:
\[ V = \pi r^2 h \]
Substituting \(r = 5m\) and \(h = 12m\):
\[ V = \pi (5)^2 (12) = 300\pi \approx 942.48 \text{ cubic meters} \]
The surface area \(A\) includes the lateral and two circular areas:
\[ A = 2\pi r h + 2\pi r^2 \]
Substituting the values:
\[ A = 2\pi (5)(12) + 2\pi (5)^2 = 120\pi + 50\pi = 170\pi \approx 534.07 \text{ square meters} \]
Scaled-Down Tank
Scaling down by a factor of \( \frac{1}{2} \) means the new dimensions are:
- New radius \(r' = \frac{5}{2} = 2.5m\)
- New height \(h' = \frac{12}{2} = 6m\)
Computing the new volume:
\[ V' = \pi (2.5)^2 (6) = 37.5\pi \approx 117.81 \text{ cubic meters} \]
Geometric Relationship
The volume scales by the cube of the factor:
\[ V' = V \times \left(\frac{1}{2}\right)^3 = 300\pi \times \frac{1}{8} = 37.5\pi \]
Since volume depends on three dimensions (length, width, height), reducing each by \( \frac{1}{2} \) results in an overall reduction by \( \frac{1}{8} \).
That means the smaller tank holds only one-eighth the volume of the original!
Q4 b). A country's population grows exponentially at 2% annually. If the population is 50 million today, estimate when it will reach 60 million. Use logarithm to solve.
Solution:
We’ll use the exponential growth formula:
$$ P = P_0 e^{rt} $$
where:
- \( P \) is the future population,
- \( P_0 \) is the initial population (50 million),
- \( r \) is the growth rate (2% or 0.02),
- \( t \) is the time in years,
- \( e \) is the mathematical constant (approximately 2.718).
We need to solve for \( t \) when \( P = 60 \) million:
$$ 60 = 50 e^{0.02t} $$
Dividing both sides by 50:
$$ \frac{60}{50} = e^{0.02t} $$
$$ 1.2 = e^{0.02t} $$
Taking the natural logarithm (ln) on both sides:
$$ \ln(1.2) = 0.02t $$
Using \( \ln(1.2) \approx 0.1823 \):
$$ 0.1823 = 0.02t $$
Solving for \( t \):
$$ t = \frac{0.1823}{0.02} = 9.12 \text{ years} $$
So, the population will reach 60 million in about 9.1 years. That means if the population is 50 million today, it will reach 60 million in approximately 9 years from now.
Q5 a). Using the Huntington-Hill method, apportion 10 parliamentary seats between three provinces with populations of 800,000, 500,000 and 700,000. Show all steps (priority values, seat allocation).
Step 1: Calculate Standard Divisor
The standard divisor is found by dividing the total population by the number of seats:
\[ \text{Standard Divisor} = \frac{(800,000 + 500,000 + 700,000)}{10} = \frac{2,000,000}{10} = 200,000 \]
Step 2: Compute Initial Quotas
Each province's quota is determined by dividing its population by the standard divisor:
Province A: \( \frac{800,000}{200,000} = 4.00 \)
Province B: \( \frac{500,000}{200,000} = 2.50 \)
Province C: \( \frac{700,000}{200,000} = 3.50 \)
Step 3: Assign Initial Seats (Lower Quota)
Each province is initially assigned the whole number part of its quota:
Province A: 4 seats
Province B: 2 seats
Province C: 3 seats
Total assigned: \( 4 + 2 + 3 = 9 \) seats. Since we need to assign 1 more seat, we move to priority values.
Step 4: Compute Priority Values
The Huntington-Hill priority value for a province after receiving \( n \) seats is:
\[ \text{Priority} = \frac{\text{Population}}{\sqrt{n(n+1)}} \]
Now, let's compute for each province's next seat (the 10th seat goes to the highest priority value):
Province A (next seat, 5th):
\[ \frac{800,000}{\sqrt{5 \times 4}} = \frac{800,000}{4.472} \approx 178,944 \]
Province B (next seat, 3rd):
\[ \frac{500,000}{\sqrt{3 \times 2}} = \frac{500,000}{2.449} \approx 204,111 \]
Province C (next seat, 4th):
\[ \frac{700,000}{\sqrt{4 \times 3}} = \frac{700,000}{3.464} \approx 202,000 \]
Step 5: Assign the Final Seat
Since Province B has the highest priority value (204,111), it receives the final seat.
Final Seat Allocation
Province A: 4 seats
Province B: 3 seats
Province C: 3 seats
Q5 b). A product price rose from Rs. 800 to Rs. 100. Calculate the percentage increase. If the new price is later reduced by 15%, find the final price.
Step 1: Percentage Increase
The formula for percentage increase is:
$$ \text{Percentage Increase} = \left( \frac{\text{New Price} - \text{Original Price}}{\text{Original Price}} \right) \times 100 $$
$$ = \left( \frac{1000 - 800}{800} \right) \times 100 $$
$$ = \left( \frac{200}{800} \right) \times 100 $$
$$ = 25\% $$
So, the price increased by 25%.
Step 2: Price After 15% Reduction
Now, if the new price (Rs. 1,000) is reduced by 15%, we calculate:
$$ \text{Reduced Price} = \text{New Price} - \left( \text{New Price} \times \frac{15}{100} \right) $$
$$ = 1000 - (1000 \times 0.15) $$
$$ = 1000 - 150 $$
$$ = 850 $$
So, after the reduction, the final price would be Rs. 850.
0 Comments:
Post a Comment